The cell cycle refers to the time that a cell has undergone for one generation. From the end of a cell division to the end of the next division, it is a cycle. The cell cycle reflects the rate of cell proliferation. The cell cycle is an important test parameter. Studying the effects of cell cycle changes plays an important role in tumor development and drug development. For example, compounds known to inhibit mitosis are mostly used to slow the growth of tumor cells.

Two stages in the cell cycle are most important: G1 to S and G2 to M; these two stages are in the period of complex and active molecular level changes, which are easily affected by environmental conditions. If they can be artificially regulated, they will be It is important to understand the growth and development of organisms and control tumor growth. It is convenient and effective to detect changes in the cell cycle, which is of great significance for drug development and disease research.
The cycle measurement of a single cell can be performed by means of time-lapse photography, but it does not represent the cycle of the cell population, so other methods are now used to measure the population cycle.
So how does the measurement of the cell cycle proceed? There are many methods for measuring the cell cycle, such as isotope labeling, flow cytometry, and fluorescence imaging based on cell imaging.
I. Isotope labeling method for measuring cell cycle
The labeled mitotic percentage method (PLM) is a commonly used method for determining cell cycle time. The principle is to pulse the labeled cells, periodically take the materials, display the labeled cells by autoradiography, and measure the cell cycle by statistically marking the percentage of mitotic cells.
Measuring principle:
1 After the cells to be tested are labeled with 3H-thymidine, all S phase cells are labeled.
2 S phase cells enter the M phase through the G2 phase, so PLM = 0 for a period of time.
3 When the M phase cells begin to appear, the cells in the last stage of the S phase have passed the G2 phase, so the interval from PLM = 0 to the occurrence of PLM is the duration of the G2 phase.
4 S phase cells gradually enter M phase, PLM rises, and when it reaches the highest point, it indicates that the cells from the last stage of S have completed M and entered G1 phase. So the time interval from the beginning of M to the PLM reaching the highest point (≈ 100%) is the duration of the M period.
5 When the PLM begins to decline, it indicates that the cells in the initial stage of the S phase have also entered the M phase, so the period from when the LM to the PLM starts to fall again is equal to the duration of the S phase.
Second, flow cytometry PI staining
The cell cycle is divided into two phases: interphase and division. The interval is divided into three phases: the pre-DNA synthesis phase (G1 phase), the DNA synthesis phase (S phase), and the late DNA synthesis phase (G2 phase). Some cells temporarily leave the cell cycle after the end of the division, stop cell division, and perform certain biological functions (G0 phase).
The principle of detecting the cell cycle:
Since the DNA content of each phase of the cell cycle is different, usually the G1 / G0 phase of normal cells has the DNA content of diploid cells (2N), while the G2 / M phase has the DNA content of tetraploid cells (4N), while S The DNA content of the period is between diploid and tetraploid. PI binds to DNA and its fluorescence intensity directly reflects the intracellular DNA content. Therefore, when the intracellular DNA content is detected by flow cytometry PI staining, the cell cycle phases can be divided into G1 / G0 phase, S phase and G2 / M phase, and the obtained flow histograms correspond to each. The cell cycle can be calculated by special software to calculate the percentage of cells in each phase.
Third, imaging-based fluorescence detection
FUCCI (fluorescent ubiquitination-based cell-cycle indicator) The globule can identify which period of the cell cycle the cell is in, so it can be used to study the progression of the cancer cell cycle. The FUCCI technique is based on the identification of two proteins that regulate overexpression of the cell cycle, geminin and Cdt1, where geminin is fused to the green fluorophore AmCyan and Cdt1 is fused to the red fluorophore mCherry. The levels of Cdt1 and geminin fluctuate with changes in the cell cycle: Cdt1 protein levels peak in the G1 phase, while geminin protein levels increase in S, G2 and M phases. This result is reflected in the expression of FUCCI nuclei in the G1 phase as red and in the S, G2 and M phases in green (Figure 2).

1 Detection method
The A375S FUCCI sphere preparation method was as follows: Corning's 96-well U-bottom low-adsorption cell culture plate was supplemented with DMEM/F 12 medium containing EGF (20 ng / mL) and B27 (1 ×) at 1,000 cells per well. Kind of board. The cells were plated (800 g, 6 min) and incubated at 37 ° C, 5% CO 2 . Finally, the spheres were washed 3 times with medium containing 10% FCS to remove EGF and B27, and culture was continued for 1 to 6 days.
2 Data analysis
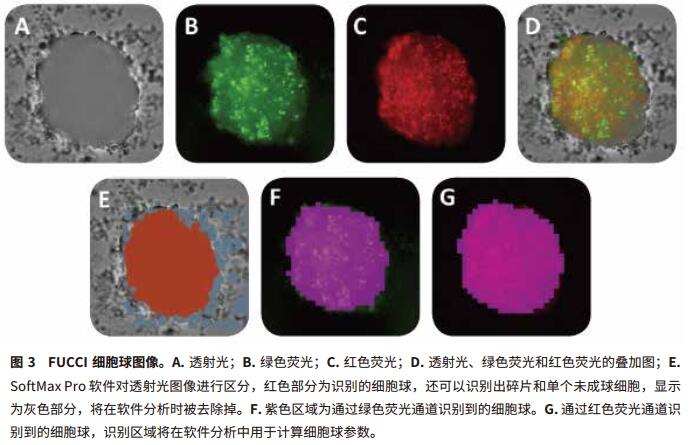
The Transmit Light Module of the MiniMax Cell Counter allows for better image quality from autofocus. “Field Analysis†in SoftMax Pro software enables custom analysis to identify overlapping parts of cells. We use a special identification method to distinguish between the target sphere and the rest of the objects, such as debris and individual cells, which are removed in subsequent analyses (Figure 2, A and E). Finally, we select the area of ​​interest and remove unwanted objects from the image. In the green and red fluorescence channels, the sphere can be easily screened by the difference in size and relative fluorescence intensity in the "Object Count" mode (Figure 2, BD, FG). Then use SoftMax Pro software to calculate the "% Area coverage" of the image and the "Object Area" (μm 2 ) of the sphere. The setting method of image acquisition and analysis is shown in Table 1.


3 results
The settings acquired and analyzed in the SoftMax Pro software allow for easy and fast resolution of single spheres in each well under the transmitted light of the green and red fluorescent channels. The SoftMax Pro software also calculates the area ratio and object area (μm 2 ) contained in all channels (Figure 3, Table 2). The best results are obtained with green and red fluorescent channels. For the FUCCI sphere, the red part of Figure 3 shows a smooth rounded sphere and the green part is on the cell surface, indicating that the cells inside the sphere are in the G1 phase and the surface cells are about to enter the M phase. The corresponding software can distinguish various changes in the size and shape of the sphere (spherical parameters), so it is often used to study the effects of various treatments, such as anticancer drugs, on cell proliferation (Figure 4). The green and red fluorescent optics in MiniMax convert 3D images into 2D projection spheres.

Fourth, high content detection method
method
1. Prepare the cell suspension, mix 40,000 cells/mL Hela cell suspension with 30 granule/cell concentration of FUCCI reagent, seed in a 96-well plate at a concentration of 4,000 cells/well, and place the plate at 37 °C, 5 Adhere for 8 hours in an environment of % CO2.
2. Treat cells with different concentrations of mitotic inhibitor and place the plates into the ImageXpress Micro system.
3. The system automatically takes a picture every 2-3 hours, using a 20x Plan Apo objective, and images of the bright field and two fluorescent channels FITC and TRITC. The experiment lasted for 48-72 hours and the cells completed 1 - 2 splits.
4. Analysis of experimental images using delay MetaXpress ® high content imaging and analysis software user custom module.


The Premo ® FUCCI Cell Cycle Indicator combines with the ImageXpress Micro High Connotation Imaging System and MetaXpress High Connotation Analysis software, which are configured to achieve efficient and accurate measurement of live cell cycles. High-throughput screening technology provides scientists with a fast, automated method for quantitatively analyzing cell cycles based on images and is able to fully record cell cycle changes over time. In addition, MetaXpress software recognizes cells in brightfield images, avoiding the toxicity of dyes to living cells. A statistically significant quantitative analysis of the same standard can be used to evaluate parameters of the effects of multiple compounds on cell cycle at different concentrations.
Posture Corrector,Posture Support,Posture Corrector Device,Back Brace Posture Corrector
XIAMEN DORRELLA HEALTH TECHNOLOGY CO.,LTD , https://www.dinglimed.com